바이너리 분류 모델에 있어서 평가 항목
Confusion Matrix 샘플 결과 TP 1 FN 29 FP 0 TN 970 Accuracy (정확도) 전체 결과에 대한 True 의 비율 Accuracy = (TP + TN) / (TP + FN + FP + TN) = 971 / 1000 = 0.971 Precision (정밀도) (모델의 관점) True(=1) 이라고 예측한 것 중
eldercoder.tistory.com
위 링크를 참조
confusn_matrix
|
>>> from sklearn.metrics import confusion_matrix
>>> print(confusion_matrix(Y_test, prediction, labels=[0, 1]))
[[ 60 47]
[148 431]]
|
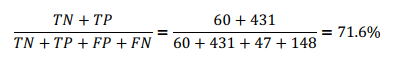
Accuracy : 전체중에 추천은 추천, 비추천은 비추천으로 응답한 비율
Precision : 전체 추천 응답수에 진짜 추천일 비율

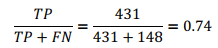
Recall : 전체 입력 추천수에 추천응답의 비율
f1 score : Precision과 Recall의 밸런스

추천(1)의 경우
|
>>> from sklearn.metrics import precision_score, recall_score, f1_score
>>> precision_score(Y_test, prediction, pos_label=1)
0.9016736401673641
>>> recall_score(Y_test, prediction, pos_label=1)
0.7443868739205527
>>> f1_score(Y_test, prediction, pos_label=1)
0.815515610217597
|
비추천(0)의 경우
|
>>> f1_score(Y_test, prediction, pos_label=0)
0.38095238095238093
|
전체
|
>>> from sklearn.metrics import classification_report
>>> report = classification_report(Y_test, prediction)
>>> print(report)
precision recall f1-score support
0.0 0.29 0.56 0.38 107
1.0 0.90 0.74 0.82 579
micro avg 0.72 0.72 0.72 686
macro avg 0.60 0.65 0.60 686
weighted avg 0.81 0.72 0.75 686
|
어느 한쪽(1)의 class 비율이 높기때문에 Accuracy는 높게 나오고 0의 데이터수는 적기 때문에 precision recall f1 score는 낮게 나오고 있다.
2853 positive samples and 575 negative samples.